
By KELLY KULTYS
NEWS EDITOR
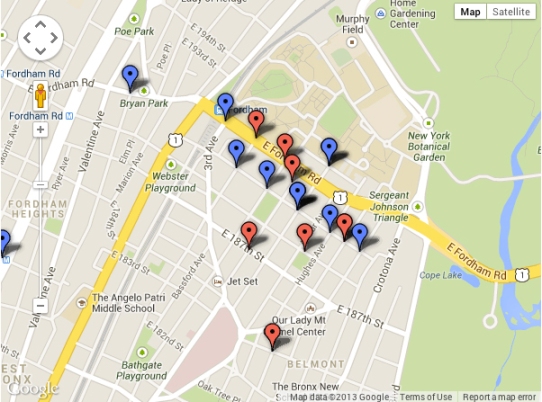
Tent20 Creator Randy Clinton transformed crimes into points based on location and victim’s gender — females red, males blue.
Today many students ask themselves “what is the point of this class?” But one student, Randy Clinton, FCRH ’14, was determined to take what he used in the classroom and apply it to his life. That is how tent20.com was born back in January 2013.
“I started to get nervous that I wasn’t learning enough or that I didn’t know how to do the things I was learning,” Clinton said. “I wanted to prove to myself that I could take the things I was learning and demonstrate it.”
One of Clinton’s main goals with the website is to take complicated or frightening data and to simplify it into a chart or graph. His most recent project involved creating a map of reported crimes in the Fordham area since January 2013.
“I’m actually getting ready to sign a lease for an apartment up here and I hadn’t lived up here before,” Clinton said, “so as I was going through [the process], people were saying ‘oh that’s a bad part, that’s a bad area to live’ and I thought that was absurd.”
Clinton decided to do some investigation of his own to see if the area surrounding Fordham was really as bad as some believe it is.
“I noticed all those emails [students] get, those security blasts that come in like clumps which make it seem like there’s some rapid crime spree going on,” Clinton said. “And again, I thought that was absurd. I was getting emotionally attached to seeing a bunch of them come in at once. You don’t think about them on the days you don’t get them.”
Clinton believed that receiving all of the security alert emails, which seemed to flood students’ inboxes, especially after the weekend, gave students feelings of apprehension at all times.
He was curious about how often incidents, such as iPhone robbery, occurred in the surrounding area.
“I figured that if those were all the security reports just out there, I could gather the data and put it into a map,” he said. “I really wanted to do something with geo-mapping.”
Geo-mapping is defined as an up-and-coming visual representation of data. It is very interactive for the user, allowing him or her to click on each individual piece of data to learn more information.
Clinton explains that Google makes it very easy to translate data into maps.
He began compiling a spreadsheet of information from the security reports, and then translated it through Google’s workflow into a geo-map.
The result of Clinton’s work was a map of the Fordham area with red and blue dots, representing women and men respectively, placed exactly where the crimes took place.
“I was curious to see if they all occurred in one area, but it seemed that they were rather spread out, ” Clinton said.
Clinton sorted the data into graphs showing the percentage of crimes that happened to men versus women. An additional graph displayed the times the incidents most frequently occurred.
“It kind of proved what I thought I was going to see,” Clinton said. “People who aren’t from this area walk around at 1 o’clock in the morning with a fancy phone out and get robbed, but if you’re just kinda walking around during the day, it’s not that bad.”
Clinton did say, however, that he was surprised how the crimes were almost split evenly between men and women.
“I was assuming at first that it would be mostly be a bunch of girls that looked vulnerable that stood out, and all of a sudden someone would take advantage of them.”
Still, there are a few flaws with the map that prevent it from giving a perfect picture of what happens off campus.
“It’s not comprehensive because it relies on a number of fallacies to get the information,” he said. “You need the person who was the victim of the crime to report it to campus security. I mean if I got robbed, I would call the police, but would I call campus security? They’re not going to do anything at the time.”
The number of crimes listed is only based off of those documented through Fordham, not the entire number committed.
“[As of Sept. 15], there have been 22 incidents this calendar year, but that doesn’t mean 22 students got robbed,” he said. “That means 22 students reported it to campus security.”
Despite the fallacies, Clinton said this was one of his most popular posts on his website.
“I got a lot of people that were interested in seeing it,” he said.
In the future, Clinton definitely hopes to use geomapping with more intricate data, such as translating a 35 page military document into an easy-to-read chart and graph.

[…] https://fordhamram.com/2013/09/19/security-data-transformed-into-geomap/ […]